Economic Potential Assessments
Skip to:
Introduction
The goal of the economic potential assessment within the renewable energy zone (REZ) process is to enable the systematic comparison of the cost of renewable energy-based generation (cost per megawatt-hour [$/MWh]) and total annual generation potential (gigawatt-hours per year [GWh/year]) available across different REZ study areas. This helps further filter technically feasible REZ study areas based on economic considerations. At this stage, calculating the costs of developing particular sites is not necessary. Rather, a consistent methodology and metric are used to assess the economic potential for each of the REZ study areas, which allows a direct comparison by the working groups and the private sector. In later steps, working groups can estimate the costs for connecting specific zones to the grid through transmission upgrades and extensions.
This step also provides a more accurate reflection of the total generation potential available within the REZs. The development adjustment factor (DAF), applied in this step, further screens the resources in zones for exclusions that may not have been explicitly captured in the technical potential assessment.
Accounting for unknowns in REZ development
In practice, only a small portion of technically feasible sites within a zone will be developed even if transmission is available. Project developers have limited capital and will prioritize sites where cost is minimized and returns are maximized. To account for this and for exclusions that were not explicitly captured in the technical potential assessment, planners can estimate how much new capacity may actually be developed in each study area through the use of DAFs.
DAFs represent the percentage (%) of technically feasible area with renewable energy resources that will likely be used after considering the many unknowns that may prevent development (such as deterred investment). DAFs are technology- and market-specific, and their development requires the input of stakeholders who will be making actual project-siting decisions. The DAF mathematically reduces the estimated technical potential of a study area without specifying exactly where each reduction would occur. This screening process helps inform future steps of the REZ process, particularly transmission planning.
As an example, consider a REZ that includes a large valley that is known to contain excellent solar resources. Some development might be welcome by local stakeholders but covering the entire valley with solar panels would likely not be acceptable. If the area has 1,000 megawatts (MW) of solar potential and the DAF is assumed to be 5%, then the screened area theoretically has the potential to site a 50 MW solar project; however, the exact location of where this development occurs (or does not occur) does not have to be known just yet.
|
Wind and Solar Photovoltaic Development Adjustment Factors in the Western REZ Initiative |
Levelized cost of energy (LCOE) and supply curves
After accounting for how much generation may actually be developed, planners can estimate how much renewable energy-based generation is available and at what cost. To do this, common metrics and tools are applied to allow systematic comparison between zones.
The levelized cost of energy (LCOE) metric represents the net present cost of a unit of electricity (typically U.S Dollar [or other currency] per megawatt-hour [$/MWh]). It offers a standardized method for comparing the costs of producing electricity across various technologies, lifespans, project sizes and capital costs. Calculation of LCOE requires information on technology costs, operation and maintenance costs, fuel costs (where applicable), associated taxes, and discount rates. Costs for generation interconnection and road access could also be factored in at this stage but are not required, as later steps in the REZ process consider transmission expansion options. Although LCOE is a useful metric, it is important to note that actual siting decisions are specific to each project and include additional factors not captured in LCOE—anticipated changes to tax incentives and demand or projected fuel prices, for example. However, this is acceptable because at this stage having a systematic method to compare zones is more of a priority then having a method to estimate the exact cost of generation.
LCOE values for electricity generation within a REZ study area can be plotted in a supply curve to facilitate comparison of the cost of energy across zones. Supply curves allow planners to quantify the energy resources (such as wind, solar, geothermal, small hydro) that can be developed at or below a certain LCOE, estimate the potential generation (GWh) of these resources for a typical year, and compare these data across study areas. On the vertical axis, supply curves show the LCOE for each potential generator in the study area. On the horizontal axis, supply curves depict the total amount of energy these generators could produce annually at or below a certain LCOE.
The example supply curve below depicts hypothetical LCOE and annual generation based on data from the Annual Technology Baseline from NREL (2018), with the technologies arranged along the horizontal axis from lowest cost per unit of energy to highest. The curve shows that the zone could potentially provide up to 14,927 GWh per year at a LCOE greater than or equal to 107 U.S. dollars per megawatt-hour. If this threshold were lowered to approximately 50 U.S. dollars per megawatt-hour the total potential generation may fall to approximately 12,500 GWh per year as depicted in the figure.
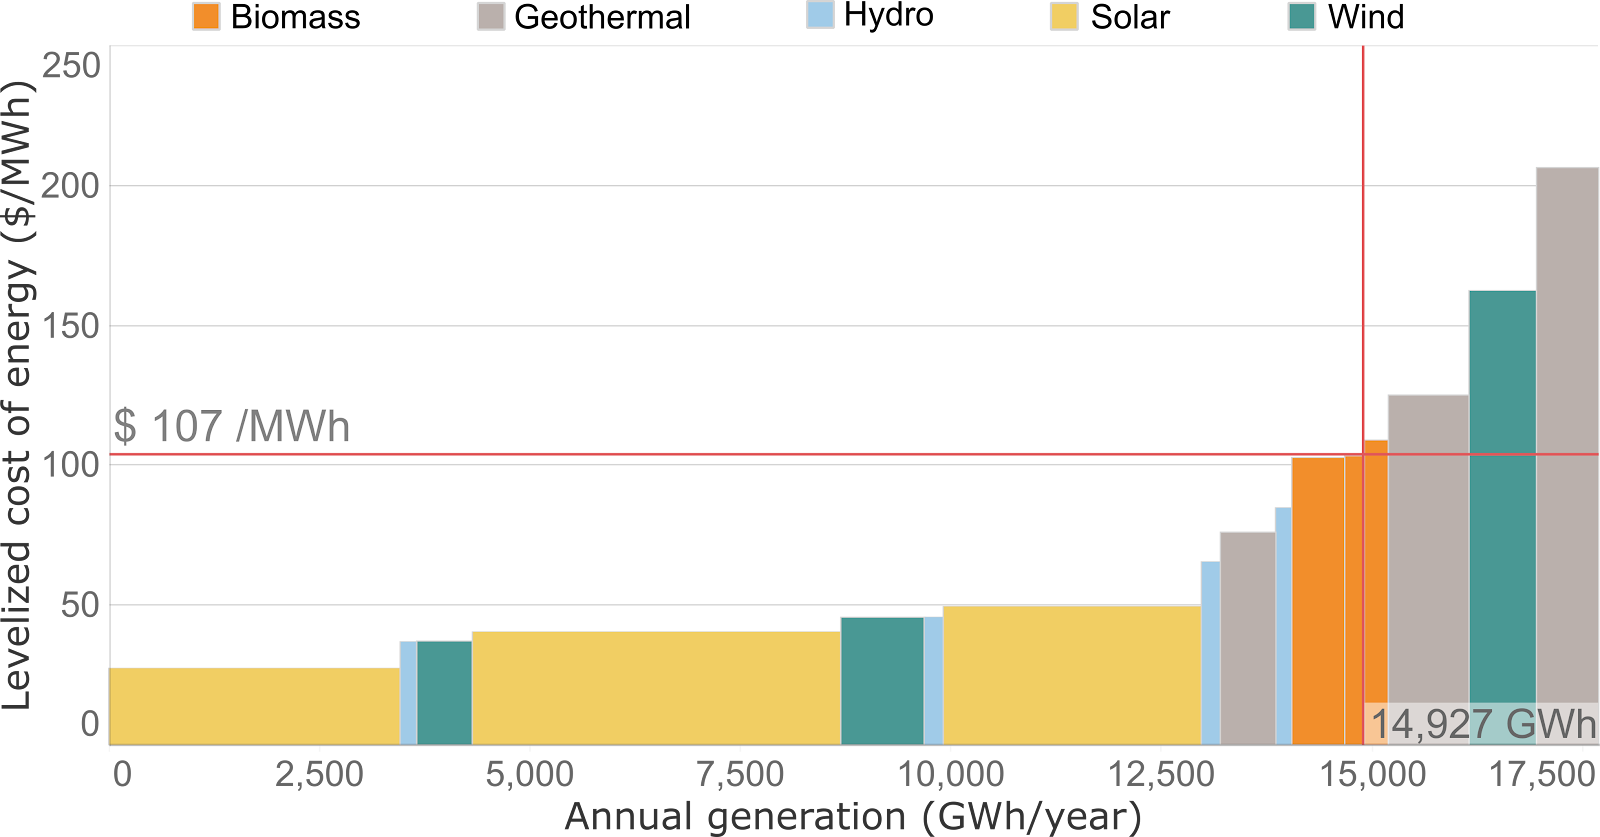
Figure. Example Supply Curve
The focus of the REZ process is on large-scale wind and solar resources as other resources (such as geothermal and mini-hydropower) are seldom sufficiently concentrated in a location to warrant development as a REZ and transmission expansion. However, when co-located within a designated REZ, these supplementary renewable energy resources may provide additional value, such as controllability from geothermal resources, and should therefore be considered in the economic potential assessment. For this reason, these additional resources are also included in the supply curve.
Reading list and case studies
Interregional Renewable Energy Zones in National Transmission Analysis
National Renewable Energy Laboratory, 2022
This report describes the methodology that the National Renewable Energy Laboratory used to identify interregional renewable energy zones (IREZs) for the National Transmission Planning Study. The aim is to develop a data-driven, replicable methodology for use in long-term regional and interregional transmission planning.
Interregional Renewable Energy Zones (IREZs)
National Renewable Energy Laboratory, 2022
Based off the 2022 National Renewable Energy Laboratory report, "Interregional Renewable Energy Zones in National Transmission Analysis," this presentation addresses the identification and analysis of interregional renewable energy zones (IREZs) for the National Transmission Planning Study.
California-Wyoming Grid Integration Study: Phase 1-Economic Analysis
National Renewable Energy Laboratory, 2014
This study presents a comparative analysis of two renewable energy options for the California energy market between 2017 and 2020—new California in-state renewable energy resources and Wyoming wind delivered to the California marketplace. Either option would add to the California resources and contribute to meeting the state's 33% renewable portfolio standard. Both options have discretely measurable differences in transmission costs, capital costs (due to the enabling of different generation portfolios), capacity values, and production costs. The purpose of this economic analysis is to compare and contrast the two different options to provide additional insight for future planning.
High Level Overview of Data Needs for Renewable Energy Analysis
National Renewable Energy Laboratory, 2016
The collection of high quality data of sufficient temporal and spatial resolution is fundamental to a meaningful assessment of a region’s technical and economic potential. This presentation provides a useful overview of the data needed to analyze the technical and economic potential of a region as well as perform REZ or grid integration studies. The presentation also indicates what data might be needed in order to assess potential risks as well as system resiliency and other policy goals such as achieving electrification of rural areas.
Western Renewable Energy Zones, Phase 1: QRA Identification Technical Report
National Renewable Energy Laboratory, 2009
This report details the process for identifying and analyzing the technical and economic potential of Qualified Resource Areas (QRA). Specific economic considerations are detailed and values are given for the variables used in the calculations for the LCOE of each type of generating resource. Special consideration is also given to financial incentives for renewable energy generation in the United States, Canada, and Mexico. This report is particularly useful for REZ stakeholders looking to incorporate the impact of a diverse range of geographically-specific policies into their studies. The report also contains an extensive characterization of data and identifies the sources of the data used for each type of renewable energy resource.
U.S. Energy Information Administration, 2018
This paper provides an excellent introduction to the metrics levelized cost of electricity (LCOE) and levelized avoided cost of electricity (LACE). In addition to a general treatment of LCOE and LACE, the paper also offers specific values for the LCOE and LACE as well as the regional variation in both for generating technologies deployed in 2020, 2022, and 2040. Although these values are specific to the United States, they are an excellent example for policymakers wishing to analyze the economic potential of their own REZs.
Levelized Cost of Electricity and Levelized Avoided Cost of Electricity Methodology Supplement
U.S. Energy Information Administration, 2013
This brief methodology provides a closer look at the variables included in LACE and LCOE calculations. Stakeholders attempting to calculate LCOEs and LACEs for generators in their study areas can use this supplement to determine what types of data they will need. Additionally, there is a brief example to help illustrate how the various costs and revenues for generators are compiled into the LCOE, LACE and net value metrics.
Estimating Renewable Energy Economic Potential in the United States: Methodology and Initial Results
National Renewable Energy Laboratory, 2016
This in-depth report details the steps taken for estimating, with high spatial resolution, the technical potential, LCOE, LACE, and net value/economic potential (LACE – LCOE) for regions in the United States. The report also considers the impact of factors such as the social cost of carbon, the declining value of new renewable generation as renewable penetration increases, the cost of interconnection for remote resources and tax credits on the economic potential of conventional and renewable resources. Although specific to the United States, the detailed methodology and handling of additional factors offer policymakers an excellent template to replicate and specific values to use as a baseline for their own studies.
Program on Technology Innovation: Integrated Generation Technology Options 2017
Electric Power Research Institute, 2018
This annual report from EPRI gives an overview of the major developments in various generating technologies and offers a range of LCOE values depending on the cost of carbon for 2016 and 2025. Although the LCOE values are tailored to the United States, the report’s methodology and LCOE calculation assumptions are nevertheless a useful guide for policymakers wishing to recreate similar metrics for their own REZ evaluations.
Utah Renewable Energy Zone (UREZ) Task Force, Phase II – Zone Identification and Scenario Analysis
Utah Renewable Energy Zone Task Force, 2010
This report, the second of two, details the refinement of zones from the technical potential assessment and the ranking of potential REZs by the overall economic merit of each zone. The report also discusses the handling of uncertainty in economic metric values and the development and analysis of scenarios of various levels of renewable energy demand. Policymakers setting out to build their own REZ study will benefit from the UREZ example, especially if they are interested in considering multiple renewable energy development targets.
Renewable Energy Zones for Balancing Siting Trade-Offs in India
Lawrence Berkeley National Laboratory, 2017
This in-depth report details the process of assessing the technical potential for renewable energy in India, the development of "project opportunity areas" (POA) and the multi-criteria scoring of these POAs based on technical, economic, and social considerations. This report is an excellent outline for policymakers seeking guidance on technical potential evaluation, economic potential evaluation, and, in particular, the evaluation of non-monetizable considerations. An additional section also covers the estimation of the capacity value of generators, allowing stakeholders to further evaluate potential renewable energy generators by their ability to contribute to resource adequacy and system reliability.
Videos
Levelized Cost of Energy (LCOE): An Overview Tutorial
National Renewable Energy Laboratory, 2017
This training video introduces levelized cost of energy (LCOE) and explains why it is important for data-driven decision making in energy planning. The training explains how to calculate the LCOE of electricity generating assets and describes key parameters, sensitivities, and some limitations. Example applications, analyses, and results are provided as well as an introduction to the Transparent Cost Database. This video was developed as part of a remote training series for the Energy Alternatives Study for the Lao People's Democratic Republic within the Smart Infrastructure for the Mekong Program.
This video concentrates on renewable energy resources and answers the key questions:
1. What is LCOE?
2. How is LCOE calculated?
3. What are its applications, limitations, sensitivities, and parameters?
Online Platforms
Renewable Energy Data Explorer
U.S. Agency for International Development and National Renewable Energy Laboratory, 2018
The Renewable Energy (RE) Data Explorer, the flagship tool of the RE Explorer, facilitates renewable energy decision making, investment, and deployment through a dynamic, online analytical tool. RE Explorer provides renewable energy data, analytical tools, and technical assistance to developers, policymakers, and decision makers in developing countries. It enables meaningful decisions that support low-emission development and ultimately reduce greenhouse gas emissions. This tool can help planners to identify and visualize potential REZs through the evaluation of accessibility and feasibility (technical potential) as well as energy resource quality and quantity. Additionally, the RE Data Catalog is a central location for research and discovery of the renewable energy resource and spatial data that power RE Data Explorer, as well as a place for researchers to contribute data in support of the project.
National Renewable Energy Laboratory
PVWatts® Calculator from NREL helps users estimate the energy production and cost of energy of grid-connected photovoltaic (PV) energy systems throughout the world. Private sector installers and others can use it to easily develop estimates of the performance of potential PV installations. The tool can be used by planners in evaluating performance of potential PV installations within study areas as part of economic assessments.
National Renewable Energy Laboratory
The System Advisor Model (SAM) from NREL is a performance and financial model designed to facilitate decision making for people involved in the renewable energy industry, including policy analysts, technology developers, project managers and engineers, and researchers. SAM makes performance predictions and cost of energy estimates for grid-connected power projects based on installation and operating costs and system design parameters that users specify as inputs to the model. Planners can use SAM to estimate costs and performances of potential projects within specific study areas of interest. These can aid in evaluating the economic potential of renewable energy resources.